City Finances
Where the money goes.
East Providence's budget is not just one number. It is schools, public safety, debt service, public works, pensions, healthcare, contracts, utilities, and the everyday cost of keeping the city running.
The basic picture
Most of the budget is already spoken for.
The largest lines are schools, public safety, debt service, and city operations. Some costs are local choices. Many are driven by contracts, law, debt schedules, pensions, healthcare, inflation, and basic service requirements.
FY2026 General Fund
$205.1M
The General Fund is the main operating budget for city and school services.
Schools
$103.5M
50.47% of the General Fund.
Public Safety
$48.8M
23.79% of the General Fund.
Debt Service
$17.8M
8.67% of the General Fund.
Public Works
$12.5M
6.08% of the General Fund.
Every $100
The FY2026 General Fund is concentrated in a few large commitments.
| Category | FY2026 | Share | Every $100 |
|---|---|---|---|
| Schools | $103.5M | 50.47% | $50.47 |
| Public Safety | $48.8M | 23.79% | $23.79 |
| Debt Service | $17.8M | 8.67% | $8.67 |
| Public Works | $12.5M | 6.08% | $6.08 |
| City Operations | $7.6M | 3.71% | $3.71 |
| Community Services | $2.9M | 1.40% | $1.40 |
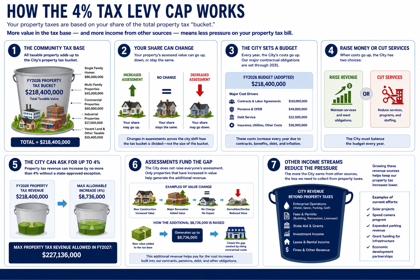
Tax Levy Explainer
How the 4% tax levy cap works.
Property taxes are based on your share of the total property tax bucket. This printable guide explains how the tax base, assessments, city costs, and other revenue sources affect pressure on the property tax bill.
Drill down
Schools and public safety are the biggest pieces.
Click each card to see what is inside the largest FY2026 budget buckets.
Schools
$103.5M
School Department appropriation and listed school revenues.
| School budget view | FY2026 | % of School Appropriation |
|---|---|---|
| Total School Department appropriation | $103.5M | 100.0% |
| School revenues shown in city budget | $44.0M | 42.5% |
| Net local share after listed school revenues | $59.5M | 57.5% |
| Listed school revenue | FY2026 | % of Listed School Revenue |
|---|---|---|
| School State Aid | $40.6M | 92.3% |
| Medicaid | $1.2M | 2.8% |
| School Other | $2.1M | 4.9% |
| Total listed school revenues | $44.0M | 100.0% |
Public Safety
$49.3M
Police, Fire, communications, animal shelter, and harbormaster.
| Public safety line | FY2026 | % of Public Safety |
|---|---|---|
| Fire Department | $29.1M | 59.1% |
| Police Department | $18.1M | 36.7% |
| Public Safety Communications | $1.5M | 3.1% |
| Animal Shelter | $440K | 0.9% |
| Harbormaster | $62K | 0.1% |
| Total Public Safety | $49.3M | 100.0% |
Police
$18.1M
Most Police spending is salaries and benefits.
| Police budget line | FY2026 | % of Police Budget |
|---|---|---|
| Salaries and benefits | $17.2M | 95.0% |
| Other operating costs | $906K | 5.0% |
| Total Police | $18.1M | 100.0% |
Fire
$29.1M
Most Fire spending is salaries and benefits.
| Fire budget line | FY2026 | % of Fire Budget |
|---|---|---|
| Salaries and benefits | $27.0M | 92.7% |
| Other operating costs | $2.1M | 7.3% |
| Total Fire | $29.1M | 100.0% |
Remaining operating departments
After the largest commitments, the rest of city government is much smaller.
This view removes the School Department, Police, Fire, Debt Service, and Miscellaneous from the FY2026 General Fund, then shows how the remaining departmental dollars are allocated.
Click to expand / collapse
Where the remaining $28.9M goes
Department-by-department, with each line shown as a share of the remaining operating department total.
| Department | FY2026 | % of Remaining Department Budgets |
|---|---|---|
| Highway | $6.0M | 20.6% |
| Refuse Disposal | $3.8M | 13.0% |
| Public Library | $2.9M | 9.9% |
| Public Buildings | $1.6M | 5.7% |
| Central Communications | $1.5M | 5.3% |
| Building Inspection | $1.1M | 3.8% |
| Information Technology | $1.1M | 3.7% |
| Central Garage | $1.1M | 3.7% |
| Finance | $989K | 3.4% |
| City Clerk | $900K | 3.1% |
| Planning | $854K | 3.0% |
| Human Resources | $853K | 2.9% |
| Recreation | $736K | 2.5% |
| Engineering | $667K | 2.3% |
| Assessment | $620K | 2.1% |
| Senior Services | $573K | 2.0% |
| Treasury | $508K | 1.8% |
| Mayor | $497K | 1.7% |
| Law | $493K | 1.7% |
| Animal Shelter | $440K | 1.5% |
| Streetlights | $430K | 1.5% |
| Director of Public Works | $335K | 1.2% |
| Canvassing Authority | $312K | 1.1% |
| Carousel | $184K | 0.6% |
| City Council | $170K | 0.6% |
| Affirmative Action / Human Services | $169K | 0.6% |
| Pierce Stadium | $136K | 0.5% |
| Harbormaster | $62K | 0.2% |
| Total Remaining Department Budgets | $28.9M | 100.0% |
Enterprise revenue is separate. Water and wastewater fees support those systems and are not the same as flexible General Fund dollars.
Four-year view
The major lines are moving up.
These adopted-budget figures show the major General Fund lines from FY2023 through FY2026.
| Budget line | FY2023 | FY2024 | FY2025 | FY2026 | Change | Growth |
|---|---|---|---|---|---|---|
| School Department | $93.9M | $96.9M | $99.4M | $103.5M | $9.6M | 10.26% |
| Fire | $25.0M | $25.4M | $27.3M | $29.1M | $4.2M | 16.78% |
| Police | $17.1M | $16.7M | $17.4M | $18.1M | $1.0M | 6.13% |
| Debt Service | $15.6M | $17.3M | $16.8M | $17.8M | $2.2M | 13.85% |
| Highway | $5.5M | $5.4M | $5.8M | $6.0M | $454K | 8.23% |
| Refuse Disposal | $3.3M | $3.7M | $3.8M | $3.8M | $479K | 14.58% |
| Public Library | $2.7M | $2.8M | $2.8M | $2.9M | $133K | 4.85% |
| Public Buildings | $1.5M | $1.4M | $1.6M | $1.6M | $183K | 12.62% |
| Central Communications | $1.2M | $1.4M | $1.5M | $1.5M | $337K | 28.22% |
| Building Inspection | $988K | $1.1M | $1.0M | $1.1M | $106K | 10.75% |
Budget vs. actual
A budget is a plan. Actual spending tells you what happened.
Most city-department figures below are the FY2024 amounts displayed in later budget books. The School Department row uses the audited School Unrestricted Fund schedule because the later budget-book display does not reconcile to the audit.
| Line | Budget | Actual | Variance | Status |
|---|---|---|---|---|
| School Department (audited) | $96.9M | $98.9M | $2.1M | over budget |
| Police | $16.7M | $18.9M | $2.2M | over budget |
| Debt Service | $17.3M | $16.8M | $491K | under budget |
| Fire | $25.4M | $25.8M | $381K | over budget |
| Refuse Disposal | $3.7M | $3.5M | $289K | under budget |
| Miscellaneous | $7.0M | $7.3M | $251K | over budget |
| Public Buildings | $1.4M | $1.6M | $205K | over budget |
| Highway | $5.4M | $5.2M | $192K | under budget |
| Public Library | $2.8M | $2.7M | $153K | under budget |
Why the school number changed
East Providence uses two school-finance reporting clocks. The City's legal fiscal year runs from November 1 through October 31, including the audited School Unrestricted Fund. School and RIDE operating reports also use June 30 measures. The City audit reports $98.94M in FY2024 education expenditures, $2.07M above the $96.87M adopted budget. A later City budget book displays $85.9M, but that figure is not the audited School Unrestricted Fund actual and should not be described as $10.9M in school underspending.
The approximately $1.3M FY2026 school deficit discussed in August is a preliminary projection for the year ended June 30, 2026. It reportedly excludes about $750K still owed to the City. It is not yet an audited October 31 City-fund result. This calendar gap, along with late audits, is one reason the underlying reconciliation records matter.
Sources: City fiscal-year definition · FY2024 City audit
Washington Bridge context
The FY2024 Police overage should be read with the bridge closure in mind. East Providence provided bridge-related traffic coverage during morning and afternoon rush hours and on nearby streets where traffic spilled over. Records reviewed by Target 12 showed East Providence had collected nearly $1.6M in police-detail reimbursements through August, and the city added a temporary $20/hour premium to bridge detail pay. This is a one-time operating pressure, not a normal baseline change.
Police FY2026 personnel costs
FY2026 Police expenses include $11.5M in salaries and $5.7M in benefits. Together, personnel costs explain most of the department budget.